Rainwater in the Landscape: Comparing 16 Canadian Cities
Premise:
Take one standardized rainwater harvesting system incorporating a 1,020 litre (225 Imp gal) tank, along with the fittings and downspout filter, and a 50 sq m (550 sq ft) roof area (the maximum area normally served by one downspout), place them in different city climates across the country, and then see what you get. With a standardized demand for 25 mm (1″) of rainfall/irrigation per week for 24 weeks in the growing season, how much landscape area can be watered with harvested rainwater alone, before needing to use potable water?
About one-third of potable water is used on average for landscapes across Canada – a huge demand on a finite resource, and a waste of many investment dollars in infrastructure and treatment. The alternative of rainwater harvested at source and used for landscape applications, could be a major factor in reducing costs for upgrading and extending municipal piping systems, and for utilizing non-treated rainwater where rainwater is perfectly suited.
The Process:
A spreadsheet calculator developed over the past two years from the study of several RWH system design processes, was used to ascertain potential catchment and estimated irrigation requirements. The number-crunching accounts for tank filling and emptying, overflow and potential subsidization with potable water, and periods where stored rainwater applications can be reduced or eliminated since rain falls on the garden areas at the same time as the roof. It is, as with all calculators, a fairly gross result that uses monthly averages, and could be enhanced with daily monitoring and by incorporating crop/landscape evapotranspiration factors. Perhaps in a future project.
Variables in the calculation include the rainfall and seasonality, based on location. Constants include the roof catchment area, tank size, catchment efficiency of 80%, and required rainfall or irrigation totalling 25 mm (1″) per week. The calculator ensures that weeks are allocated based on number of days, and not the general ‘4 weeks per month’ (for example, August has 4.43 weeks). Average 1971 to 2000 monthly rainfall data – in lieu of total precipitation – was taken from Environment Canada’s website for the locations noted, mainly since in cold climates snow accumulation cannot always be attributed to usable precipitation due to evaporation (actually, sublimation – water molecules going from solid to gaseous form), or wind.
Climate data was retrieved from Environment Canada’s website, http://climate.weather.gc.ca/index_e.html
Details:
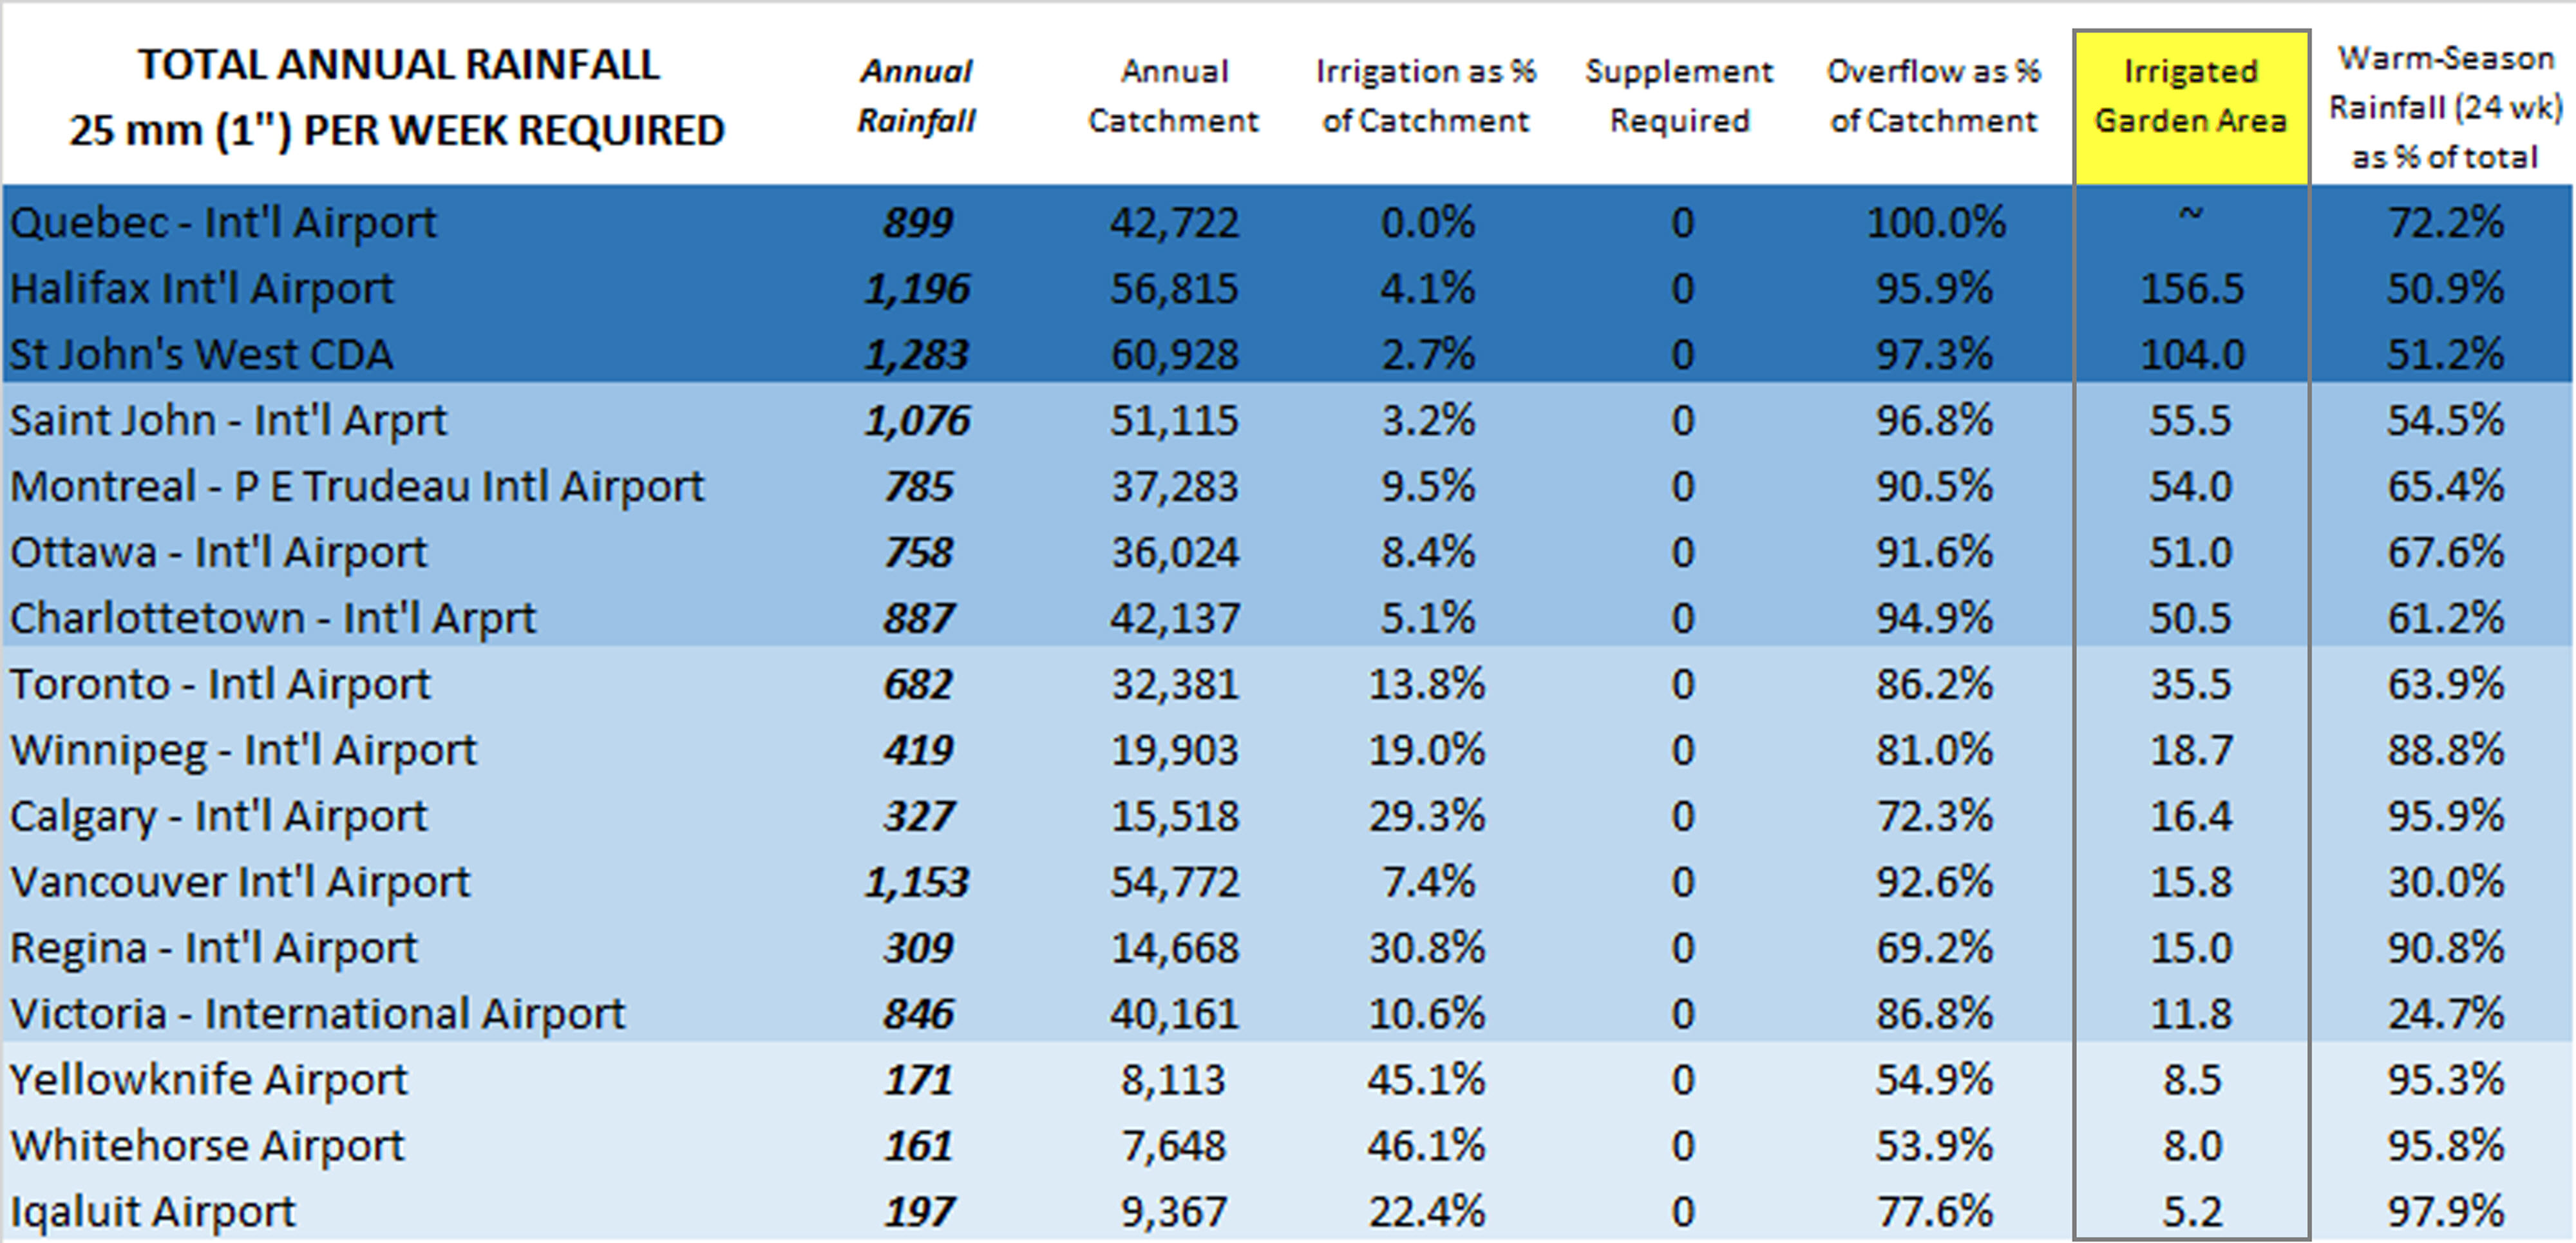
The chart outlines the garden area (sq m) served by the standard rainwater harvesting system in the sixteen cities. Ranking is from largest garden area to smallest, with Quebec City showing no apparent need for rainwater harvesting, since more than sufficient rainfall exists to meet the landscape demand.
Cities Ranked by Garden Size
There is no direct correlation between annual rainfall amounts and garden size, or between irrigation demand and annual rainfall. Decisive is the seasonal timing of rainfall and period of demand. In this case study, the catchment area has been eliminated as a variable.
Additional information can be procured through KDA by email to Ken Nentwig at ken@rainwatercanada.ca.